


User-defined
A p-y curve of any shape can be entered numerically as a table of points with coordinates [y, p]. This approach is suitable when y and p values obtained from measurements or other tests are available. It can also be used to simulate a curve type that is not offered by the program.
A p-y curve defined by a table of points is shown in Figure 1.
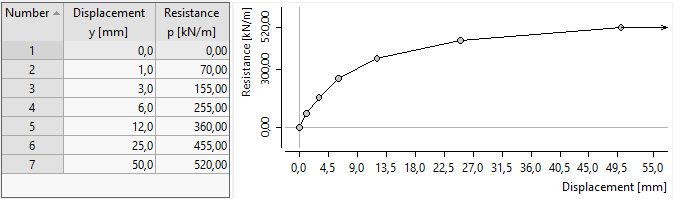 Figure 1: p-y curve defined by a table of points
In general, p-y curves depend on depth, which means that a soil usually has a different p-y curve shape at different depths. When defining a p-y curve using a table of points, this dependence must therefore be taken into account, and multiple tables of points for different depths below the ground surface should be used for a single soil. Thick soil layers in particular should be divided into thinner sublayers, each modeled as a soil with its own p-y curve table.